Estimation of a GARCH(1,1) model
The HET command in SHAZAM provides features for
maximum likelihood estimation of models with ARCH or GARCH errors.
Conditional normality of the errors is assumed.
The estimation requires the use of a numerical optimization algorithm.
The algorithm works as follows.
- Starting values for the parameters of the mean equation are
obtained from an OLS regression. For an ARCH(q) or
GARCH(p,q) process the starting values for the parameters of the
conditional variance equation are obtained from a regression
of the OLS squared residuals on a constant and q lags. For
a GARCH process, the starting values for the parameters on
the lagged conditional variances are set to zero.
Different starting values can be set with the
START=option on theHETcommand.
- Pre-sample estimates are required for the squared errors and
the conditional variances. Discussion of this initialization is
given in McCullough and Renfro [1999].
The
PRESAMPoption on theHETcommand sets the pre-sample values to the average of the squared OLS residuals (or to the average of the squared residuals evaluated at the starting parameter values). If thePRESAMPoption is not specified then the pre-sample values are introduced as an additional parameter. An estimated value is then obtained by maximizing the value of the log-likelihood function. The estimate is reported as the coefficientDELTA_on the SHAZAM estimation output.
- An initial Hessian estimate is constructed from the outer
product of the gradient. Analytic expressions for the derivatives
are used (see Engle [1982] and Bollerslev [1986]).
- Armed with the various starting values, the estimation can proceed.
SHAZAM uses a quasi-Newton algorithm. A description of the quasi-Newton
method is given in Judge, Griffiths, Hill, Lutkepohl and Lee
[1985, pp. 958-960]. The updating steps use analytic expressions
for the first derivatives.
- At model convergence, an estimate of the variance-covariance matrix of the parameter estimates is obtained from the inverse of the information matrix. The information matrix is defined as the negative of the expectation of the matrix of second-order derivatives. Expressions for the information matrix are given in Engle [1982] and Bollerslev [1986]. Alternative estimates for the variance-covariance matrix are presented in the section on benchmark comparisons of coefficients and standard errors.
 Pitfalls are:
- The numerical optimization algorithm does not guarantee convergence.
- The solution method does not guarantee that the coefficients of the conditional variance equation will be non-negative and in the region required for stationarity.
The following warning messages give a signal that the estimation has failed.
THE STARTING VALUES GIVE NEGATIVE VARIANCE OR OVERFLOWS |
The above message indicates that negative coefficients for the conditional variance equation were calculated as the default starting values.
...MAXIMUM NUMBER OF ITERATIONS
|
The default iteration limit is 100 iterations. The above message indicates that the estimation algorithm failed to reach a solution within the iteration limit.
**** FAILURE TO COMPLETE A LINE SEARCH IN 20 FUNCTION EVALUATIONS. |
The above message indicates that the algorithm was unsuccessful in finding a solution.
...MATRIX ERROR...MAGNITUDE BELOW MACHINE PRECISION IN ROW -3. |
The above message indicates that the variance-covariance matrix of the parameter estimates could not be computed.
*** WARNING - STATIONARITY CONSTRAINTS NOT SATISFIED
|
The above message indicates that the coefficients of the conditional variance equation are not in the region required for stationarity.
Example
The SHAZAM commands (filename:
ARCH2.SHA)
below estimate a GARCH(1,1) model for the data set of
daily exchange rate changes for the Deutschemark/British pound.
SAMPLE 1 1974 READ (DMBP.txt) Y DAYDUM * Preliminary OLS estimation OLS Y / DN GF * Estimation results: Table 2, column 4 (Bollerslev and Ghysels, 1996) HET Y / GARCH=1 PRESAMP STDRESID=E RESID=E1 * Diagnostic Testing STAT E OLS E / GF ARIMA E GENR E2=E*E ARIMA E2 * Get the conditional standard deviation GENR HSE=E1/E GENR DAY=TIME(0) * Smooth the results NONPAR HSE DAY / METHOD=LOWESS PREDICT=HSMTH SMOOTH=0.1 * Plot the conditional standard deviation GRAPH HSE HSMTH / TIME LINEONLY STOP |
The SHAZAM output can be viewed. The results show that the estimated GARCH(1,1) conditional variance function is:
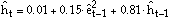
where the êt are the residuals. The standardized residuals are defined as:

If the GARCH(1,1) model describes the data then the standardized
residuals should have zero mean and unit variance and be
independently and identically distributed.
In the SHAZAM program, the standardized residuals are saved with the
STDRESID= option on the HET command.
A set of diagnostic tests is then generated.
The SHAZAM output shows the following test statistics based on the
standardized residuals.
| Statistic | p-value | |
|---|---|---|
| Mean | -0.018 | |
| Variance | 0.998 | |
| Skewness | -0.347 | |
| Excess kurtosis | 3.53 | |
| Jarque-Bera test | 1060.0 | < 0.0005 |
| Q(20) | 19.3 | 0.503 |
| Q2(20) | 17.5 | 0.620 |
Note: Q(20) and Q2(20) are the Ljung-Box-Pierce portmanteau tests for up to twentieth order serial correlation in the standardized and the squared standardized residuals respectively.
The Q(20) and Q2(20) statistics indicate no serial correlation in either the standardized residuals or the squared standardized residuals. This suggests that the GARCH(1,1) model has some success in explaining the time-varying volatility in the data.
However, the sample excess kurtosis for the standardized residuals shows strong evidence of leptokurtosis. An alternative estimation strategy presented in Baillie and Bollerslev [1989] is to use conditional leptokurtic distributions (for example, the t-distribution) for modelling ARCH processes.
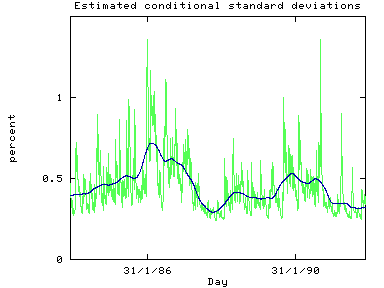
A way of presenting the results is to plot the estimated conditional
standard deviations. Emphasis to the pattern of volatility can be
obtained by smoothing the data.
The SHAZAM program used the LOWESS locally weighted regression
method that is implemented with the METHOD=LOWESS
option on the NONPAR command to smooth the
data. The figure below shows the estimated conditional standard
deviations and the smoothed results.
 [SHAZAM Guide home]
SHAZAM output
|_SAMPLE 1 1974
|_READ (DMBP.txt) Y DAYDUM
UNIT 88 IS NOW ASSIGNED TO: DMBP.txt
   2 VARIABLES AND     1974 OBSERVATIONS STARTING AT OBS       1

|_* Preliminary OLS estimation
|_OLS Y / DN GF
 OLS ESTIMATION
    1974 OBSERVATIONS     DEPENDENT VARIABLE = Y
...NOTE..SAMPLE RANGE SET TO:      1,   1974

 R-SQUARE =   0.0000     R-SQUARE ADJUSTED =   0.0000
VARIANCE OF THE ESTIMATE-SIGMA**2 =  0.22102
STANDARD ERROR OF THE ESTIMATE-SIGMA =  0.47013
SUM OF SQUARED ERRORS-SSE=   436.29
MEAN OF DEPENDENT VARIABLE = -0.16427E-01
LOG OF THE LIKELIHOOD FUNCTION = -1311.10

                             ASYMPTOTIC
VARIABLE   ESTIMATED  STANDARD   T-RATIO        PARTIAL STANDARDIZED ELASTICITY
  NAME    COEFFICIENT   ERROR   --------   P-VALUE CORR. COEFFICIENT  AT MEANS
CONSTANT -0.16427E-01 0.1058E-01  -1.552     0.121-0.035     0.0000     1.0000

DURBIN-WATSON = 1.9805    VON NEUMANN RATIO = 1.9815    RHO =  0.00937
RESIDUAL SUM = -0.14766E-13  RESIDUAL VARIANCE =  0.22102
SUM OF ABSOLUTE ERRORS=   648.23
R-SQUARE BETWEEN OBSERVED AND PREDICTED = 0.0000
RUNS TEST:  963 RUNS, 1028 POS,    0 ZERO,  946 NEG  NORMAL STATISTIC = -1.0508
COEFFICIENT OF SKEWNESS =  -0.2497 WITH STANDARD DEVIATION OF 0.0551
COEFFICIENT OF EXCESS KURTOSIS =   3.6399 WITH STANDARD DEVIATION OF 0.1101

JARQUE-BERA NORMALITY TEST- CHI-SQUARE(2 DF)= 1102.8823 P-VALUE= 0.000

     GOODNESS OF FIT TEST FOR NORMALITY OF RESIDUALS - 60 GROUPS
OBSERVED  [statistics not shown]
EXPECTED  [statistics not shown]
CHI-SQUARE =  438.3392 WITH 57 DEGREES OF FREEDOM, P-VALUE= 0.000

|_* Estimation results: Table 2, column 4 (Bollerslev and Ghysels, 1996)
|_HET Y / GARCH=1 PRESAMP STDRESID=E RESID=E1
...NOTE..SAMPLE RANGE SET TO:     1,  1974
      1974 OBSERVATIONS

ARCH     HETEROSKEDASTICITY MODEL    1974 OBSERVATIONS
         ANALYTIC DERIVATIVES
PRE-SAMPLE VARIANCE ESTIMATE =  0.22102

  QUASI-NEWTON METHOD USING BFGS U DATE FORMULA

INITIAL STATISTICS :
TIME =    0.021 SEC.   ITER. NO.     1 FUNCTION EVALUATIONS     1
LOG-LIKELIHOOD FUNCTION=   -1217.268
COEFFICIENTS
 -0.1642679E-01  0.1723165      0.2208491       0.000000
GRADIENT
   122.2147      -299.7114       84.31881       110.2291

FINAL STATISTICS :
TIME =    0.142 SEC.   ITER. NO.    16 FUNCTION EVALUATIONS    25
LOG-LIKELIHOOD FUNCTION=   -1106.607
COEFFICIENTS
 -0.6194411E-02  0.1075673E-01  0.1531225      0.8060014
GRADIENT
  0.2928278       2.689984      0.1493853      0.2967491

SQUARED CORR. COEF. BETWEEN OBSERVED AND PREDICTED   0.00000

ASY. COVARIANCE MATRIX OF PARAMETER ESTIMATES IS ESTIMATED USING
THE INFORMATION MATRIX

LOG OF THE LIKELIHOOD FUNCTION = -1106.61

                             ASYMPTOTIC
VARIABLE   ESTIMATED  STANDARD   T-RATIO        PARTIAL STANDARDIZED ELASTICITY
  NAME    COEFFICIENT   ERROR   --------   P-VALUE CORR. COEFFICIENT  AT MEANS
         MEAN EQUATION:
CONSTANT -0.61944E-02 0.8376E-02 -0.7396     0.460-0.017     0.0000     0.3771
         VARIANCE EQUATION:
ALPHA_    0.10757E-01 0.1928E-02   5.579     0.000 0.12
ALPHA_    0.15312     0.1940E-01   7.893     0.000 0.17
PHI_      0.80600     0.2184E-01   36.91     0.000 0.63

|_* Diagnostic Testing
|_STAT E
NAME        N    MEAN        ST. DEV      VARIANCE     MINIMUM      MAXIMUM
E          1974 -0.17749E-01 0.99902     0.99803      -6.7716       5.2625

|_OLS E / GF
 OLS ESTIMATION
    1974 OBSERVATIONS     DEPENDENT VARIABLE = E
...NOTE..SAMPLE RANGE SET TO:      1,   1974

 R-SQUARE =   0.0000     R-SQUARE ADJUSTED =   0.0000
VARIANCE OF THE ESTIMATE-SIGMA**2 =  0.99803
STANDARD ERROR OF THE ESTIMATE-SIGMA =  0.99902
SUM OF SQUARED ERRORS-SSE=   1969.1
MEAN OF DEPENDENT VARIABLE = -0.17749E-01
LOG OF THE LIKELIHOOD FUNCTION = -2798.54

VARIABLE   ESTIMATED  STANDARD   T-RATIO        PARTIAL STANDARDIZED ELASTICITY
  NAME    COEFFICIENT   ERROR    1973 DF   P-VALUE CORR. COEFFICIENT  AT MEANS
CONSTANT -0.17749E-01 0.2249E-01 -0.7894     0.430-0.018     0.0000     1.0000

DURBIN-WATSON = 1.8975    VON NEUMANN RATIO = 1.8985    RHO =  0.05065
RESIDUAL SUM = -0.44409E-13  RESIDUAL VARIANCE =  0.99803
SUM OF ABSOLUTE ERRORS=   1431.1
R-SQUARE BETWEEN OBSERVED AND PREDICTED = 0.0000
RUNS TEST:  963 RUNS, 1022 POS,    0 ZERO,  952 NEG  NORMAL STATISTIC = -1.0711
COEFFICIENT OF SKEWNESS =  -0.3474 WITH STANDARD DEVIATION OF 0.0551
COEFFICIENT OF EXCESS KURTOSIS =   3.5342 WITH STANDARD DEVIATION OF 0.1101

JARQUE-BERA NORMALITY TEST- CHI-SQUARE(2 DF)= 1060.0264 P-VALUE= 0.000

     GOODNESS OF FIT TEST FOR NORMALITY OF RESIDUALS - 60 GROUPS
OBSERVED  [statistics not shown]
EXPECTED  [statistics not shown]
CHI-SQUARE =  233.9221 WITH 57 DEGREES OF FREEDOM, P-VALUE= 0.000

|_ARIMA E
    ARIMA MODEL
NUMBER OF OBSERVATIONS =1974
...NOTE..SAMPLE RANGE SET TO:     1,  1974

     IDENTIFICATION SECTION - VARIABLE=E
NUMBER OF AUTOCORRELATIONS =  24
NUMBER OF PARTIAL AUTOCORRELATIONS =  12

             0     0 0
SERIES  (1-B) (1-B  )  E

  NET NUMBER OF OBSERVATIONS = 1974
MEAN=  -0.17749E-01   VARIANCE=   0.99803       STANDARD DEV.=   0.99902

  LAGS                      AUTOCORRELATIONS                          STD ERR
  1 -12    0.05 -.01 0.02 0.03 0.02 0.00 -.01 0.02 0.02 0.01 -.04 -.01   0.02
 13 -24    0.00 0.04 0.00 -.01 -.01 0.00 0.01 -.03 0.00 0.01 0.01 0.06   0.02

 MODIFIED BOX-PIERCE (LJUNG-BOX-PIERCE) STATISTICS  (CHI-SQUARE)
    LAG    Q    DF  P-VALUE       LAG    Q    DF  P-VALUE
     1    5.06   1  .024          13   14.17  13  .362
     2    5.27   2  .072          14   17.04  14  .254
     3    6.14   3  .105          15   17.04  15  .316
     4    7.68   4  .104          16   17.12  16  .378
     5    8.19   5  .146          17   17.32  17  .433
     6    8.19   6  .224          18   17.33  18  .500
     7    8.39   7  .299          19   17.38  19  .564
     8    9.28   8  .319          20   19.30  20  .503
     9    9.94   9  .355          21   19.33  21  .564
    10   10.12  10  .430          22   19.52  22  .613
    11   13.79  11  .245          23   19.71  23  .659
    12   14.16  12  .291          24   27.45  24  .284

  LAGS                  PARTIAL AUTOCORRELATIONS                      STD ERR
  1 -12    0.05 -.01 0.02 0.03 0.01 0.00 -.01 0.02 0.02 0.01 -.04 -.01   0.02

|_GENR E2=E*E
|_ARIMA E2
    ARIMA MODEL
NUMBER OF OBSERVATIONS =1974
...NOTE..SAMPLE RANGE SET TO:     1,  1974

     IDENTIFICATION SECTION - VARIABLE=E2
NUMBER OF AUTOCORRELATIONS =  24
NUMBER OF PARTIAL AUTOCORRELATIONS =  12

             0     0 0
SERIES  (1-B) (1-B  )  E2

  NET NUMBER OF OBSERVATIONS = 1974
MEAN=   0.99784       VARIANCE=    5.5236       STANDARD DEV.=    2.3502

  LAGS                      AUTOCORRELATIONS                          STD ERR
  1 -12    0.04 -.01 -.03 0.00 0.00 -.04 -.03 -.01 0.00 0.02 -.01 -.02   0.02
 13 -24    -.03 0.02 0.04 0.01 -.02 -.02 -.01 0.00 -.01 0.00 -.01 0.01   0.02

 MODIFIED BOX-PIERCE (LJUNG-BOX-PIERCE) STATISTICS  (CHI-SQUARE)
    LAG    Q    DF  P-VALUE       LAG    Q    DF  P-VALUE
     1    2.51   1  .113          13   11.44  13  .574
     2    2.60   2  .273          14   12.54  14  .563
     3    4.27   3  .234          15   16.08  15  .377
     4    4.27   4  .370          16   16.15  16  .443
     5    4.27   5  .511          17   16.79  17  .469
     6    6.72   6  .347          18   17.44  18  .493
     7    7.97   7  .335          19   17.49  19  .556
     8    8.35   8  .400          20   17.51  20  .620
     9    8.36   9  .498          21   17.87  21  .657
    10    9.06  10  .526          22   17.87  22  .714
    11    9.44  11  .581          23   18.26  23  .743
    12    9.99  12  .617          24   18.33  24  .787

  LAGS                  PARTIAL AUTOCORRELATIONS                      STD ERR
  1 -12    0.04 -.01 -.03 0.00 0.00 -.04 -.02 -.01 0.00 0.02 -.02 -.02   0.02

|_* Get the conditional standard deviation
|_GENR HSE=E1/E
|_GENR DAY=TIME(0)
|_* Smooth the results
|_NONPAR HSE DAY / METHOD=LOWESS PREDICT=HSMTH SMOOTH=0.1

    1974 OBSERVATIONS     DEPENDENT VARIABLE = HSE
...NOTE..SAMPLE RANGE SET TO:      1,   1974

NONPARAMETRIC SMOOTHING USING LOWESS METHOD
SMOOTH PARAMETER= 0.10000     ITERATIONS= 0     DELTA= 0.000
NUMBER OF NEAREST NEIGHBORS - R =    197

 R-SQUARE =   0.4305     R-SQUARE ADJUSTED =   0.4246
ERROR VARIANCE         SIGMA**2 =       0.16193E-01
STANDARD ERROR         SIGMA =          0.12725
SUM OF SQUARED ERRORS  SSE =             31.622
EQUIVALENT NUMBER OF PARAMETERS - K1 =   21.179
                                - K2 =   15.135
                                - K3 =   18.157

CROSS-VALIDATION MEAN SQUARE ERROR =    0.16310E-01

MODEL SELECTION TESTS - SEE JUDGE ET AL. (1985,P.242)
 AKAIKE (1969) FINAL PREDICTION ERROR - FPE =     0.16367E-01
    (FPE IS ALSO KNOWN AS AMEMIYA PREDICTION CRITERION - PC)
 AKAIKE (1973) INFORMATION CRITERION - LOG AIC =  -4.1125
 SCHWARZ (1978) CRITERION - LOG SC =              -4.0526
MODEL SELECTION TESTS - SEE RAMANATHAN (1992,P.167)
 CRAVEN-WAHBA (1979)
    GENERALIZED CROSS VALIDATION - GCV =          0.16368E-01
 HANNAN AND QUINN (1979) CRITERION =              0.16731E-01
 RICE (1984) CRITERION =                          0.16370E-01
 SHIBATA (1981) CRITERION =                       0.16363E-01
 SCHWARZ (1978) CRITERION - SC =                  0.17378E-01
 AKAIKE (1974) INFORMATION CRITERION - AIC =      0.16367E-01

|_* Plot the conditional standard deviation
|_GRAPH HSE HSMTH / TIME LINEONLY
     1974 OBSERVATIONS
 SHAZAM WILL NOW MAKE A PLOT FOR YOU
 NO SYMBOLS WILL BE PLOTTED, LINE ONLY
|_STOP
 [Back to Top]
 |
[SHAZAM Guide home] |