For the two variable linear regression equation the parameter of interest is usually the slope parameter. With the assumptions that the equation errors have zero mean, the explanatory variable is non-random and the model is correctly specified, it can be shown that the OLS estimator is an unbiased estimator of the slope parameter. With the additional assumption that the errors are normally distributed then it follows that the OLS estimator has a normal distribution.
With a sample of data, the OLS estimation rule can be applied to get an estimate of the slope parameter. The OLS estimate will be smaller or larger than the true parameter. However, if estimates were computed from a "large" number of random samples then the average parameter estimate over all samples will be equal to the true parameter value.
The above ideas can be illustrated with the help of computer simulation. Repeated samples of data can be generated that are consistent with a regression model. The properties of the OLS estimation rule can then be analyzed. This is known as a Monte Carlo study.
This example is adapted from the presentation in Section 6.5 of Griffiths, Hill and Judge [1993, pp. 219 - 223]. A data set on household expenditure for food was used to obtain OLS estimation results for a food expenditure relationship. It is now considered that these results are not numerical estimates but instead describe the true model for household expenditure on food. That is, assume that the true linear regression model is:
Y = 7.3832 + 0.2323 INCOME + e
where the error term is normally distributed with mean 0 and
variance 46.853.
The computer simulation proceeds as follows. For a sample size of
N=40 :
NOR
function on the GENR command is used to generate normal
random numbers.
Y where INCOME is fixed.
The above steps are repeated. At each replication a different set of
expenditures Y is computed. In this example, the number
of replications is set at 1000. The experiment then yields 1000 estimates
of the slope parameter using a sample size of N=40.
The sampling variability in the estimates can be summarized by plotting
the empirical frequency distribution of the estimates.
An interesting question is: What happens to the sampling performance
of the OLS estimator as the sample size N is increased ?
One way of investigating this is to reproduce each observation in the
variable INCOME twice. This then gives a sample size of
N=80.
The SHAZAM commands (filename:
MCARLO.SHA) below
perform the Monte Carlo study. An experiment with N=40
is set-up. The 1000 estimates of the slope parameter are saved in the
variable B40. This is followed by an experiment with
N=80. The 1000 estimates from this experiment are saved in the
variable B80. The command file illustrates various SHAZAM
features and the interested user should consult the
SHAZAM User's Reference Manual for further details on the
SHAZAM commands.
SAMPLE 1 40 READ (GHJ.txt) FOOD INCOME / CLOSE * Run an OLS regression and save the coefficients in the variable BETA. OLS FOOD INCOME / COEF=BETA * Get the standard error GEN1 SIG=SQRT($SIG2) * Set the number of replications for the Monte Carlo experiment. GEN1 NREP=1000 SET RANFIX NODOECHO NOOUTPUT DIM B40 NREP * Use a DO-loop to do repeat operations DO #=1,NREP * Generate random normal numbers with standard deviation SIG. GENR E=NOR(SIG) * Generate Y GENR Y = BETA:2 + BETA:1 * INCOME + E * Run an OLS regression and save the estimated coefficients. OLS Y INCOME / COEF=BTEMP GEN1 B40:#=BTEMP:1 ENDO DELETE FOOD INCOME E Y * Now duplicate the observations and repeat the Monte Carlo experiment. SAMPLE 41 80 READ (GHJ.txt) FOOD INCOME / CLOSE SAMPLE 1 40 READ (GHJ.txt) FOOD INCOME / CLOSE SAMPLE 1 80 DIM B80 NREP DO #=1,NREP GENR E=NOR(SIG) GENR Y = BETA:2 + BETA:1 * INCOME + E OLS Y INCOME / COEF=BTEMP GEN1 B80:#=BTEMP:1 ENDO SET OUTPUT * Analyze the results - a histogram gives a frequency distribution. SAMPLE 1 NREP STAT B40 B80 PLOT B40 / HISTO GROUPS=30 PLOT B80 / HISTO GROUPS=30 STOP |
The SHAZAM output can be viewed. The histogram
presentation gives one method of showing the frequency distribution of the
slope estimate.
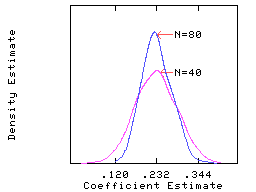
The figure below shows a smoothed version of the histogram plot.
This figure was prepared using nonparametric density estimation that is
implemented with the NONPAR command in SHAZAM.
The above figure shows a comparison of the distribution of the slope
estimate for a sample size of N=40 and N=80.
The graph shows that the distribution of the estimates is approximately
normal and an increase in sample size leads to increased precision of the
OLS estimator.
 [SHAZAM Guide home]
 |_SAMPLE 1 40
 |_READ (GHJ.txt) FOOD INCOME / CLOSE

 UNIT 88 IS NOW ASSIGNED TO: GHJ.txt
    2 VARIABLES AND       40 OBSERVATIONS STARTING AT OBS       1

 |_* Run an OLS regression and save the coefficients in the variable BETA.
 |_OLS FOOD INCOME / COEF=BETA

  OLS ESTIMATION
       40 OBSERVATIONS     DEPENDENT VARIABLE = FOOD
 ...NOTE..SAMPLE RANGE SET TO:    1,   40

  R-SQUARE =    .3171     R-SQUARE ADJUSTED =    .2991
 VARIANCE OF THE ESTIMATE-SIGMA**2 =   46.853
 STANDARD ERROR OF THE ESTIMATE-SIGMA =   6.8449
 SUM OF SQUARED ERRORS-SSE=   1780.4
 MEAN OF DEPENDENT VARIABLE =   23.595
 LOG OF THE LIKELIHOOD FUNCTION = -132.672

 VARIABLE   ESTIMATED  STANDARD   T-RATIO        PARTIAL STANDARDIZED ELASTICITY
   NAME    COEFFICIENT   ERROR      38 DF   P-VALUE CORR. COEFFICIENT  AT MEANS
 INCOME     .23225      .5529E-01   4.200      .000  .563      .5631      .6871
 CONSTANT   7.3832      4.008       1.842      .073  .286      .0000      .3129

 |_* Get the standard error
 |_GEN1 SIG=SQRT($SIG2)
 ..NOTE..CURRENT VALUE OF $SIG2=   46.853
 |_* Set the number of replications for the Monte Carlo experiment.
 |_GEN1 NREP=1000
 |_SET RANFIX NODOECHO NOOUTPUT
 |_DIM B40 NREP
 |_* Use a DO-loop to do repeat operations
 |_DO #=1,NREP
 |_* Generate random normal numbers with standard deviation SIG.
 |_  GENR E=NOR(SIG)
 |_* Generate Y
 |_  GENR Y = BETA:2 + BETA:1 * INCOME + E
 |_* Run an OLS regression and save the estimated coefficients.
 |_  OLS Y INCOME / COEF=BTEMP
 |_  GEN1 B40:#=BTEMP:1
 |_ENDO
 |_DELETE FOOD INCOME E Y

 |_* Now duplicate the observations and repeat the Monte Carlo experiment.
 |_SAMPLE 41 80
 |_READ (GHJ.txt) FOOD INCOME / CLOSE

 |_SAMPLE 1 40
 |_READ (GHJ.txt) FOOD INCOME / CLOSE

 |_SAMPLE 1 80
 |_DIM B80 NREP
 |_DO #=1,NREP
 |_  GENR E=NOR(SIG)
 |_  GENR Y = BETA:2 + BETA:1 * INCOME + E
 |_  OLS Y INCOME / COEF=BTEMP
 |_  GEN1 B80:#=BTEMP:1
 |_ENDO
 |_SET OUTPUT

 |_* Analyze the results - a histogram gives a frequency distribution.
 |_SAMPLE 1 NREP
 |_STAT B40 B80
 NAME        N   MEAN        ST. DEV      VARIANCE     MINIMUM      MAXIMUM
 B40       1000   .23098       .55417E-01   .30710E-02   .29141E-01   .40478
 B80       1000   .23206       .39947E-01   .15957E-02   .12131       .39348

 |_PLOT B40 / HISTO GROUPS=30

      1000 OBSERVATIONS

 GROUP COUNTS
 GROUP       1       2       3       4       5       6       7       8
 GROUP       9      10      11      12      13      14      15      16
 GROUP      17      18      19      20      21      22      23      24
 GROUP      25      26      27      28      29      30
 COUNT      2.      2.      1.      5.     11.     16.     13.     28.
 COUNT     30.     51.     59.     61.     72.     79.     69.     92.
 COUNT     74.     65.     53.     42.     60.     31.     27.     16.
 COUNT     18.     10.      4.      6.      0.      3.

 HISTOGRAM - B40
   PCT.    N
   .097   97  I
   .093   93  I
   .089   89  I                              XX
   .085   85  I                              XX
   .081   81  I                              XX
   .077   77  I                          XX  XX
   .073   73  I                          XX  XXXX
   .069   69  I                        XXXXXXXXXX
   .065   65  I                        XXXXXXXXXXXX
   .061   61  I                      XXXXXXXXXXXXXX
   .057   57  I                    XXXXXXXXXXXXXXXX    XX
   .053   53  I                    XXXXXXXXXXXXXXXXXX  XX
   .049   49  I                  XXXXXXXXXXXXXXXXXXXX  XX
   .045   45  I                  XXXXXXXXXXXXXXXXXXXX  XX
   .041   41  I                  XXXXXXXXXXXXXXXXXXXXXXXX
   .037   37  I                  XXXXXXXXXXXXXXXXXXXXXXXX
   .033   33  I                  XXXXXXXXXXXXXXXXXXXXXXXX
   .029   29  I                XXXXXXXXXXXXXXXXXXXXXXXXXXXX
   .025   25  I              XXXXXXXXXXXXXXXXXXXXXXXXXXXXXXXX
   .021   21  I              XXXXXXXXXXXXXXXXXXXXXXXXXXXXXXXX
   .017   17  I              XXXXXXXXXXXXXXXXXXXXXXXXXXXXXXXX  XX
   .013   13  I          XXXXXXXXXXXXXXXXXXXXXXXXXXXXXXXXXXXXXXXX
   .009    9  I        XXXXXXXXXXXXXXXXXXXXXXXXXXXXXXXXXXXXXXXXXXXX
   .005    5  I      XXXXXXXXXXXXXXXXXXXXXXXXXXXXXXXXXXXXXXXXXXXXXX  XX
   .001    1  IXXXXXXXXXXXXXXXXXXXXXXXXXXXXXXXXXXXXXXXXXXXXXXXXXXXXXXXX  XX
              I---------I---------I---------I---------I---------I---------I
              .647E-01  .120      .176      .231      .286      .342      .397

 |_PLOT B80 / HISTO GROUPS=30

      1000 OBSERVATIONS

 GROUP COUNTS
 GROUP       1       2       3       4       5       6       7       8
 GROUP       9      10      11      12      13      14      15      16
 GROUP      17      18      19      20      21      22      23      24
 GROUP      25      26      27      28      29      30
 COUNT      0.      1.      4.      3.      5.     13.     21.     32.
 COUNT     35.     47.     55.     69.     74.     81.     85.     80.
 COUNT     68.     56.     50.     48.     43.     36.     30.     26.
 COUNT     16.      9.      4.      3.      3.      3.

 HISTOGRAM - B80
   PCT.    N
   .097   97  I
   .093   93  I
   .089   89  I
   .085   85  I                            XX
   .081   81  I                          XXXX
   .077   77  I                          XXXXXX
   .073   73  I                        XXXXXXXX
   .069   69  I                      XXXXXXXXXX
   .065   65  I                      XXXXXXXXXXXX
   .061   61  I                      XXXXXXXXXXXX
   .057   57  I                      XXXXXXXXXXXX
   .053   53  I                    XXXXXXXXXXXXXXXX
   .049   49  I                    XXXXXXXXXXXXXXXXXX
   .045   45  I                  XXXXXXXXXXXXXXXXXXXXXX
   .041   41  I                  XXXXXXXXXXXXXXXXXXXXXXXX
   .037   37  I                  XXXXXXXXXXXXXXXXXXXXXXXX
   .033   33  I                XXXXXXXXXXXXXXXXXXXXXXXXXXXX
   .029   29  I              XXXXXXXXXXXXXXXXXXXXXXXXXXXXXXXX
   .025   25  I              XXXXXXXXXXXXXXXXXXXXXXXXXXXXXXXXXX
   .021   21  I            XXXXXXXXXXXXXXXXXXXXXXXXXXXXXXXXXXXX
   .017   17  I            XXXXXXXXXXXXXXXXXXXXXXXXXXXXXXXXXXXX
   .013   13  I          XXXXXXXXXXXXXXXXXXXXXXXXXXXXXXXXXXXXXXXX
   .009    9  I          XXXXXXXXXXXXXXXXXXXXXXXXXXXXXXXXXXXXXXXXXX
   .005    5  I        XXXXXXXXXXXXXXXXXXXXXXXXXXXXXXXXXXXXXXXXXXXX
   .001    1  I  XXXXXXXXXXXXXXXXXXXXXXXXXXXXXXXXXXXXXXXXXXXXXXXXXXXXXXXXXX
              I---------I---------I---------I---------I---------I---------I
              .112      .152      .192      .232      .272      .312      .352
 |_STOP
[SHAZAM Guide home]